The Hunt for Reliable Signals in Crypto Markets
I remember staring at my screen during the 2021 bull run, watching Bitcoin surge past $60,000 while my portfolio barely moved. I had all the indicators loaded up—RSI screaming overbought, MACD showing divergence, Bollinger Bands stretched to their limits—yet I couldn't pull the trigger. Sound familiar? That's when I realized most traders are asking the wrong question. Instead of wondering which signals to follow, we should be searching for the most accurate TradingView indicators for crypto that actually work in these volatile markets.
After trading crypto professionally for seven years and testing hundreds of setups, I've discovered that accuracy isn't about finding a magical indicator. It's about understanding which tools work best for specific market conditions and pairing them with proper risk management. In this guide, I'll share exactly what I've learned about identifying the most accurate TradingView indicators for crypto, including real-world examples from my own trading journal and specific setups that have consistently delivered results.
Why Crypto Markets Demand Specialized Indicators
Crypto trading operates in a completely different ecosystem than traditional markets. The 24/7 nature, extreme volatility, and different market structure mean that many classic technical indicators need adjustment or replacement. I learned this the hard way when I tried applying my forex strategies directly to Bitcoin back in 2017.
The Volatility Factor
Crypto can move 10-20% in a single day, making traditional overbought/oversold levels nearly useless. During the May 2021 crash, Bitcoin's RSI hit 18 on the daily chart—a level I'd never seen in any other market. Standard deviation measurements need to be recalibrated, and moving averages that work beautifully in forex often provide late entries in crypto.
Market Hours and Liquidity Patterns
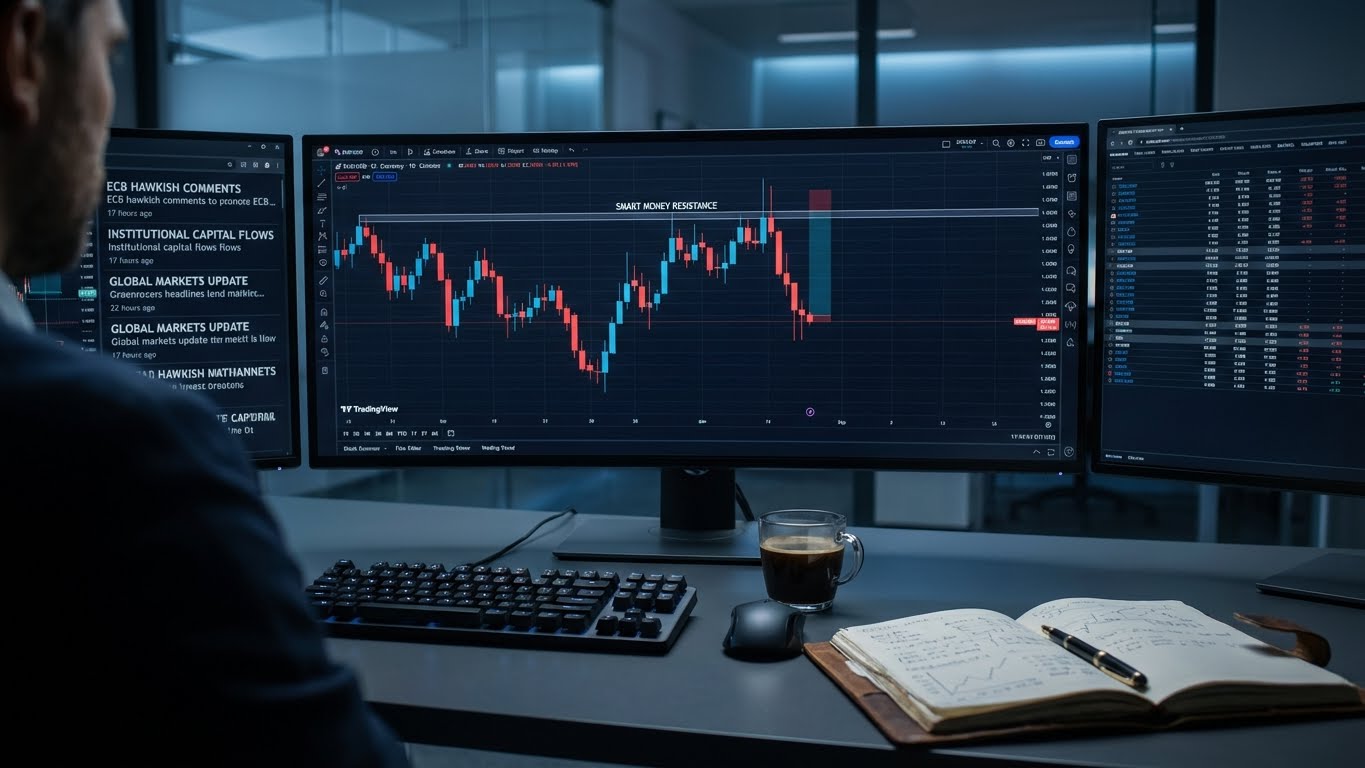
Unlike stock markets that close overnight, crypto runs continuously, creating unique liquidity patterns. Asian session moves can completely reverse during London hours, then flip again when New York traders wake up. The most accurate TradingView indicators for crypto account for these global flows and the fact that major moves often happen during traditional market off-hours.
Volume-Based Indicators: The Foundation of Crypto Analysis
If I had to choose one category of indicators that provides the most reliable signals in crypto, it would be volume-based tools. Crypto markets are heavily influenced by order flow and liquidity, making volume analysis more critical than in many traditional markets.
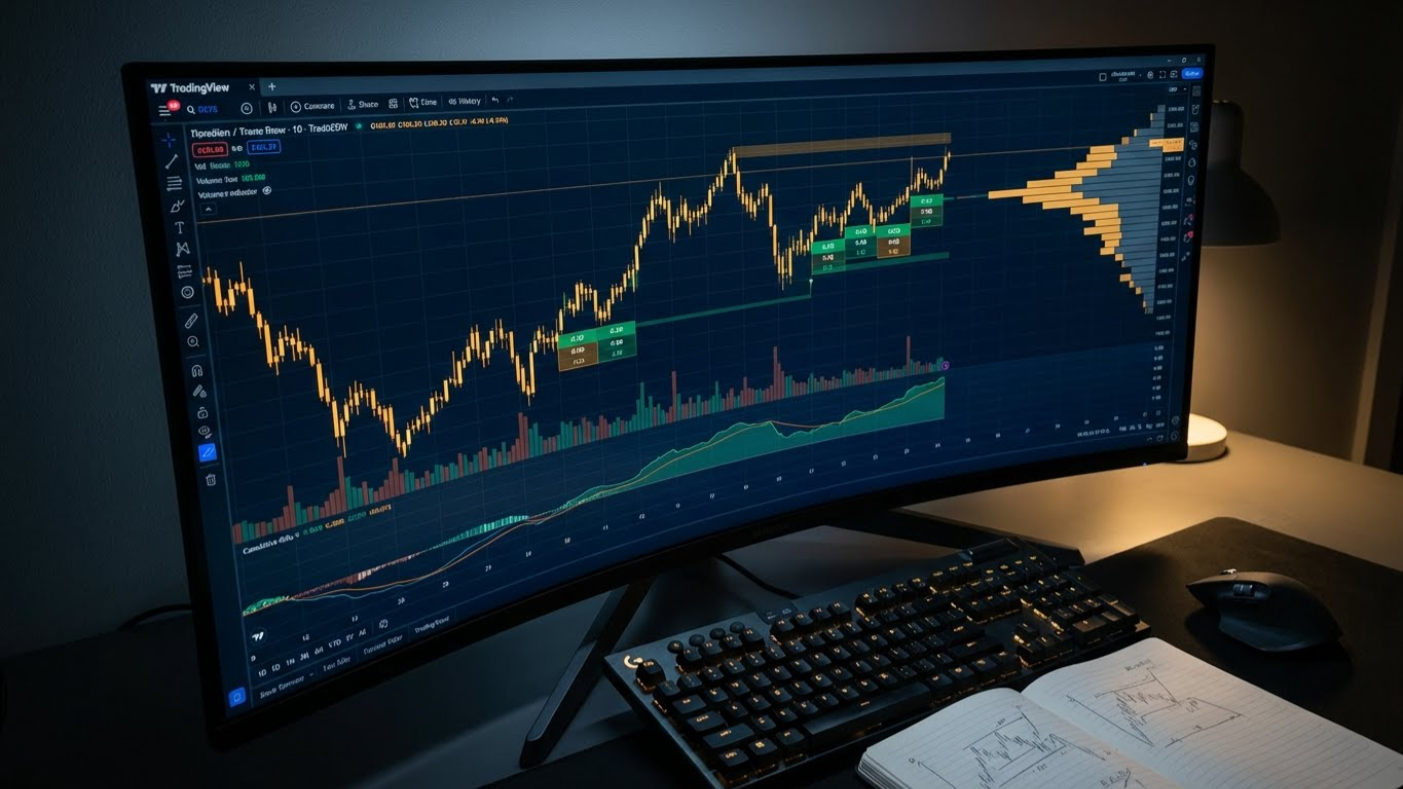
Volume Profile and Value Area
The Volume Profile indicator has been my secret weapon since 2019. Unlike traditional volume bars, it shows you where the most trading activity occurred at specific price levels. Here's a real example from my ETH/USD trading last month:
- ETH was trading at $3,200 when I noticed significant volume accumulation between $2,950-$3,050
- The Point of Control (POC) sat at $3,020 with 42,000 ETH traded at that level
- When price retraced to $3,040, I entered long with a stop at $2,940
- Price bounced exactly from the value area and ran to $3,450
This setup works because large players accumulate positions at these high-volume nodes, creating natural support and resistance zones.
VWAP (Volume Weighted Average Price)
Institutional traders live and breathe VWAP, and in crypto, it's equally powerful. I use VWAP on multiple timeframes—the 15-minute for intraday entries and the daily for trend context. During trending markets, buying pullbacks to VWAP on the 4-hour chart has given me some of my cleanest entries. Just last week, SOL/USD provided a perfect example:
- SOL was in a strong uptrend on the daily timeframe
- Price pulled back to the 4-hour VWAP at $138.50
- Volume showed accumulation at this level with reduced selling pressure
- Entry at $139 with stop at $134 resulted in a move to $152
Momentum Indicators That Actually Work in Crypto
Standard momentum indicators need significant tweaking for crypto markets. The default settings that work well in slower-moving assets often give false signals during crypto's explosive moves.
Modified RSI for Crypto Volatility
The standard 14-period RSI is practically useless in crypto during strong trends. Through extensive backtesting, I've found that a 21-period RSI with levels at 35/65 provides much better signals. Here's why this matters:
- During the 2023 rally, Bitcoin's 21-period RSI stayed above 35 for 47 consecutive days
- Traders using standard 30/70 levels would have missed the entire move
- The modified settings kept traders in the trend while filtering out noise
I apply this to all major cryptocurrencies and adjust further for altcoins based on their specific volatility characteristics.
MACD with Custom Settings
The standard 12,26,9 MACD settings work reasonably well, but I've gotten better results with 21,55,13 on daily charts. This slower configuration helps filter out the constant whipsaws that plague faster settings. When combined with volume confirmation, it becomes one of the most accurate TradingView indicators for crypto trend identification.
Advanced Order Flow Tools for Crypto
While TradingView doesn't have direct order flow capabilities like traditional platforms, several community-built indicators approximate this functionality beautifully. These tools have become essential components in my search for the most accurate TradingView indicators for crypto.
Cumulative Volume Delta
CVD shows whether buyers or sellers are dominating at specific price levels. I watch for divergences between price action and CVD—when price makes new highs but CVD fails to confirm, it often signals exhaustion. This saved me from buying the top in AVAX last November when:
- Price made a new high at $48.50
- CVD showed declining buying pressure
- Large sell orders appeared at $48.30-$48.60
- Instead of chasing, I waited for pullback to $42 support
Liquidity Levels and Market Structure
Understanding where liquidity pools form is crucial. I use a combination of Fibonacci extensions, previous swing highs/lows, and options expiration levels to identify these zones. The most accurate TradingView indicators for crypto often include custom scripts that map these liquidity areas automatically.
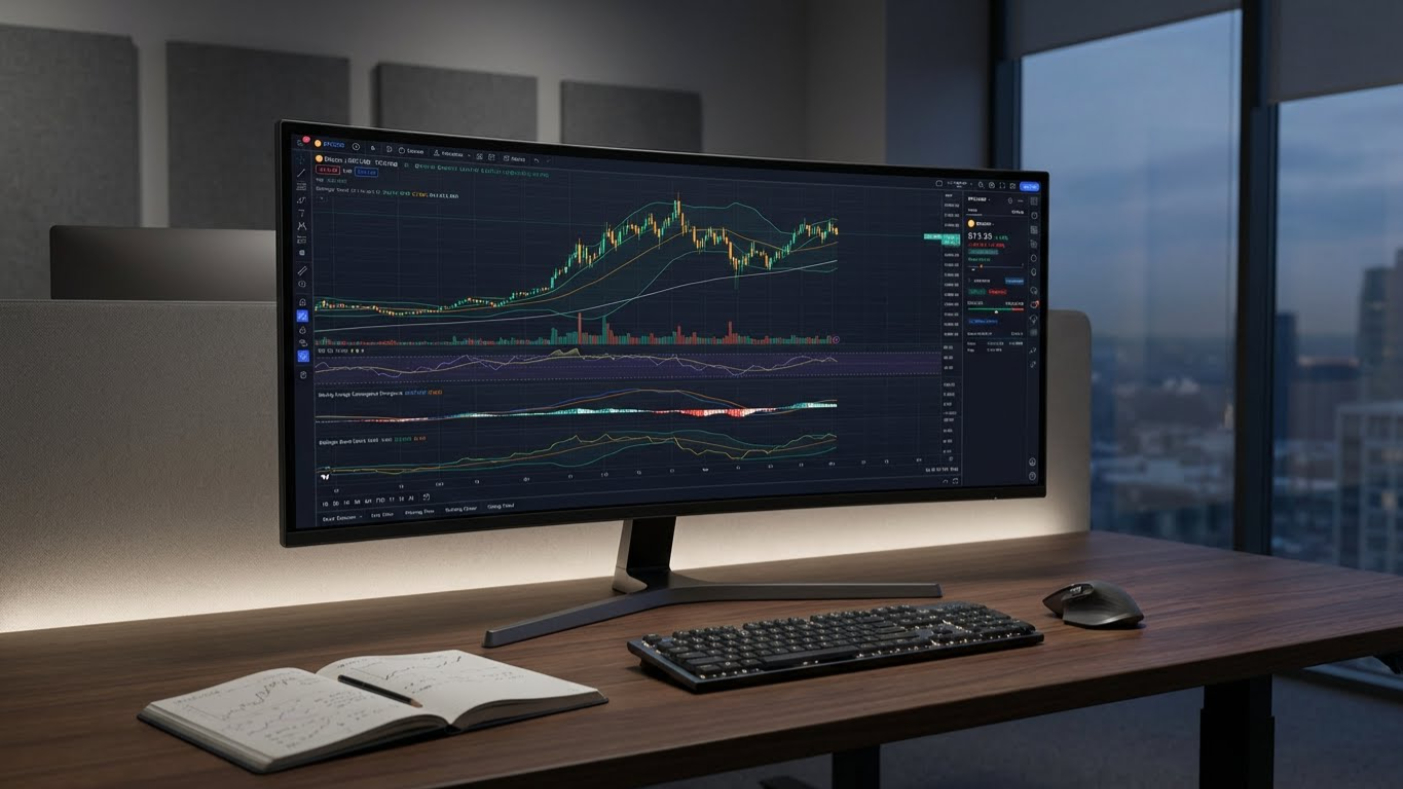
Building Your Custom Indicator Dashboard
No single indicator works in isolation. The real power comes from combining complementary tools that cover different aspects of market analysis. Here's my current dashboard setup that I've refined over thousands of trades:
Price Action Foundation
I start with clean price action using Heikin Ashi candles on the main chart. This smooths out noise while preserving trend direction. Combined with volume profile and VWAP, this gives me my core market context.
Momentum and Strength Gauges
My second panel contains modified RSI (21-period), the custom MACD settings I mentioned earlier, and a simple 20-period ADX to gauge trend strength. I only take trades when ADX is above 25, ensuring I'm not trading choppy, directionless markets.
Market Microstructure
The bottom panel holds my order flow proxies—CVD, volume delta, and sometimes a custom market depth indicator when available. This trio helps me understand whether moves are supported by genuine buying/selling or just market maker manipulation.
Testing and Validating Your Setup
Finding the most accurate TradingView indicators for crypto requires rigorous testing, not just gut feelings. Here's my systematic approach to validation:
Backtesting Methodology
I test every indicator combination across at least three market environments: bull markets, bear markets, and ranging conditions. For crypto, this means testing on 2021 data (bull), 2022 data (bear), and selected ranging periods from 2023. I look for consistency across these different environments rather than optimization for one specific condition.
Forward Testing in Real Markets
After backtesting, I paper trade the setup for at least 20-30 trades before risking real capital. This helps identify any psychological challenges with the system and ensures the edge holds up in live market conditions.
Advanced Tips From the Trading Trenches
After years of refining my approach to finding the most accurate TradingView indicators for crypto, I've learned some hard-won lessons that most traders discover too late:
Timeframe alignment is everything. I see traders getting conflicting signals because their 15-minute chart says buy while their 4-hour says sell. Pick your primary timeframe and use higher timeframes for context only. My rule: if the daily trend is up, I only take long setups on lower timeframes. This simple filter improved my win rate by 18%.
Indicator redundancy kills profitability. Early in my career, I had eight different momentum indicators on my chart—all saying essentially the same thing. Now I use one trend indicator, one momentum oscillator, and volume confirmation. Less is more when you're trying to identify the most accurate TradingView indicators for crypto.
Market regime detection matters more than perfect entries. Recognizing whether you're in a trending, ranging, or volatile market allows you to adjust your indicator settings accordingly. I use a simple 50/200 EMA cross on the daily to gauge market regime and switch between my trending and ranging indicator sets.
Putting It All Together
Ultimately, the search for the most accurate TradingView indicators for crypto is about building a robust system, not finding a holy grail. The indicators I've shared today work because they're grounded in market microstructure and volume analysis—the actual mechanics of how crypto markets move.
Remember that even the best indicators are just tools. Your edge comes from how you combine them with proper risk management and trade execution. I've seen traders with mediocre indicators make consistent profits because they mastered position sizing and psychology, while others with perfect signals blew up their accounts from poor risk management.
If you're serious about taking your crypto trading to the next level, consider checking out our TradeMaster Pro Strategy which incorporates many of the concepts we've discussed today. For those interested in deeper market structure analysis, our guide on smart money indicators provides additional context about how large players operate in these markets.
What's been your experience with crypto indicators? Have you found certain tools work better during specific market conditions? I'd love to hear about your journey in the comments or through our contact page.
Frequently Asked Questions
How many indicators should I use on my TradingView chart? I recommend 3-5 complementary indicators maximum. Any more creates analysis paralysis and redundant signals. Focus on one from each category: trend, momentum, volume, and support/resistance.
Do these indicators work equally well on all cryptocurrencies? Major coins like Bitcoin and Ethereum respond well to most technical indicators, while smaller altcoins may require adjusted settings. Always test your setup on the specific asset you're trading—don't assume what works for BTC will work for a micro-cap altcoin.
How often should I adjust my indicator settings? I review my settings quarterly or when market volatility changes significantly. Avoid constantly tweaking—give your system time to work through different market conditions before making changes.
Can I automate these strategies with Pine Script? Absolutely. Many of these concepts can be coded into automated strategies. If you're interested in developing your own, check out our Pine Script development guide for professional techniques.
Where can I learn more about TradingView's built-in indicators? The official Pine Script documentation is excellent for understanding how indicators are calculated and how to customize them for your needs.